Development and Debugging
Introduction
Streamlabs Desktop is your main tool while you are working on your application. With it you can test and develop your application in a 100% production-like environment. We have a set of tools and utilities to help you to develop and debug applications faster.
Installing your application for development
To install and test your application inside Streamlabs Desktop, first you should open the settings menu:
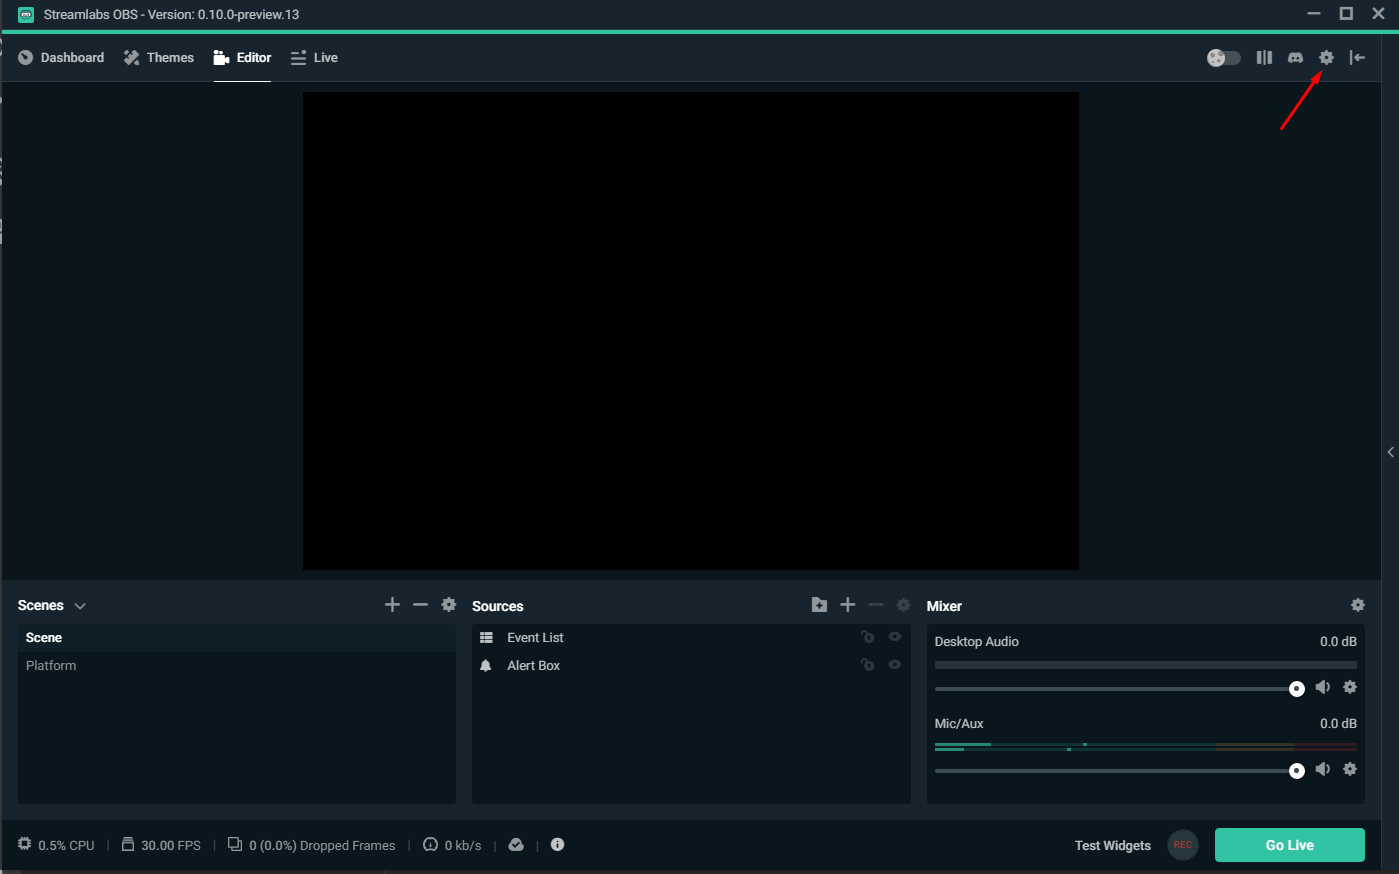
Click on the gear icon to open Settings
Then you should navigate to Developer section. Here you should load your application by clicking on Browse button and selecting the folder with the application. In the App Token input field you should paste the application token from Streamlabs Platform.
When you are ready, click on the Load App button.
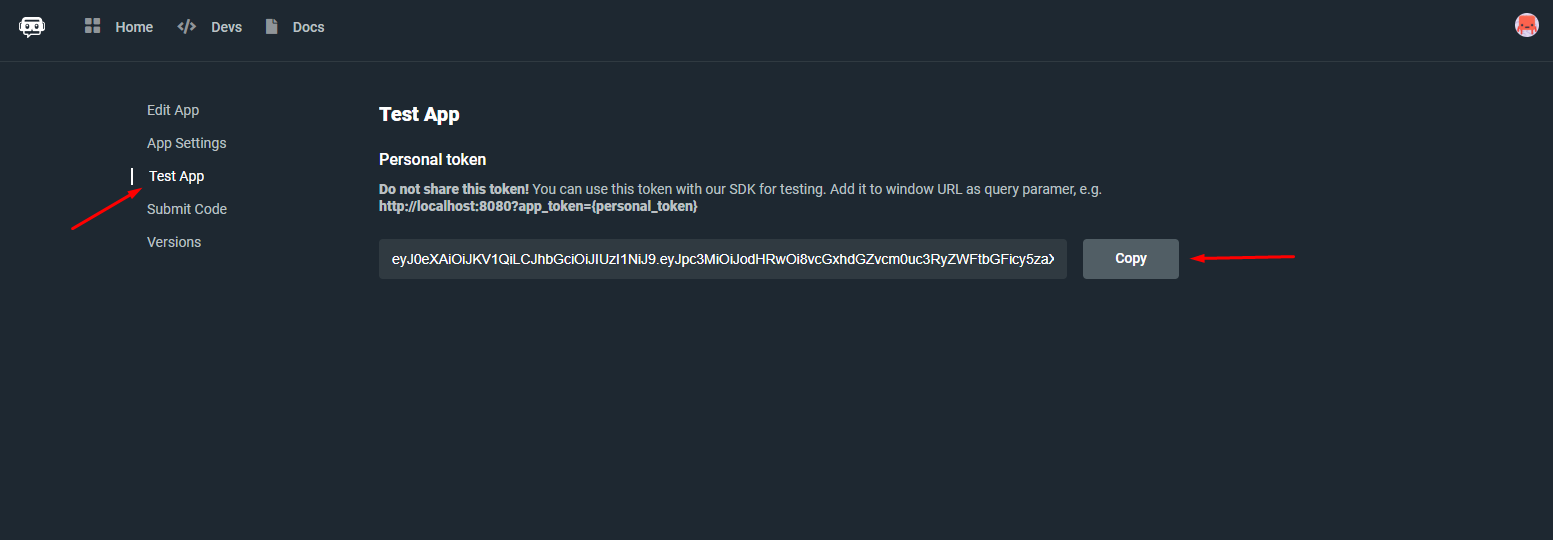
Copy your personal token
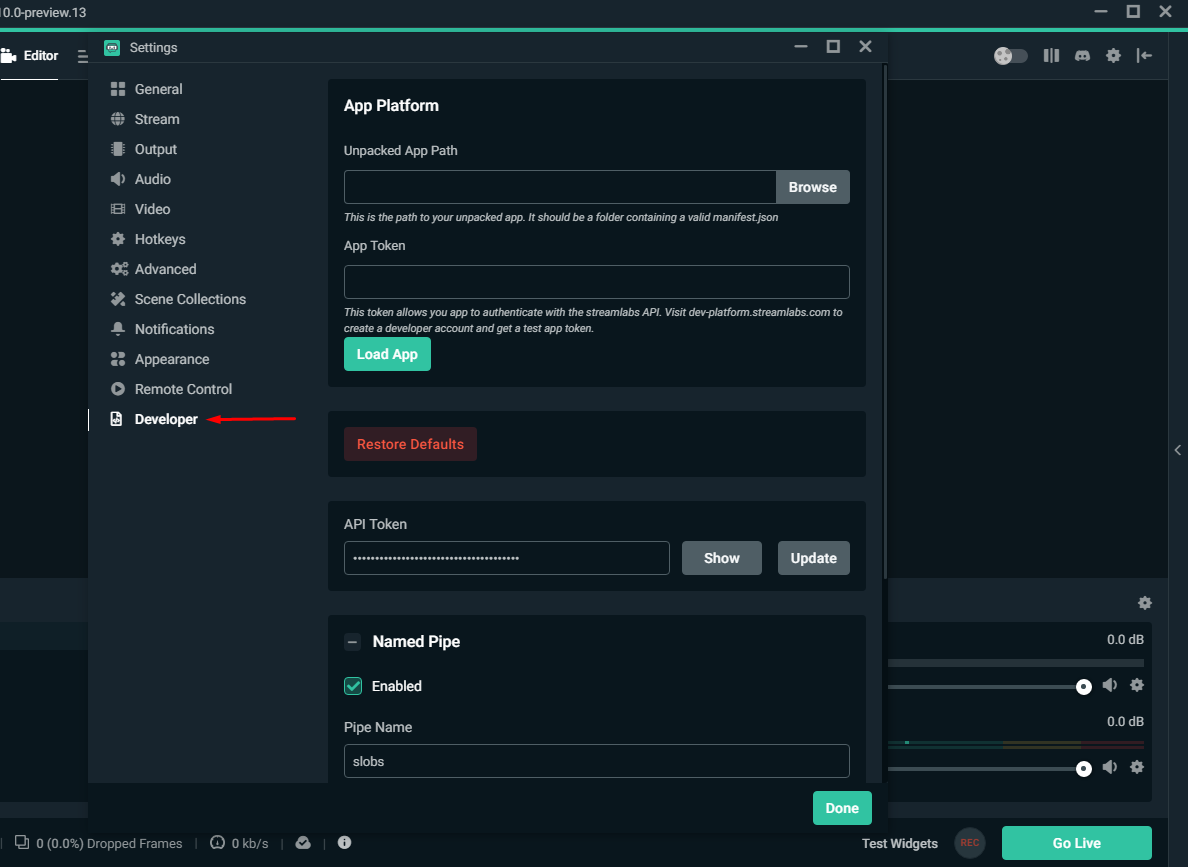
Load the test verions of your application
On top of the screen (if you have provided a pages section in the manifest.json) a page will appear if your application has injected any pages. When you navigate to your page a chrome dev tools window will pop up, which will allow you to better debug your application.

Top navigation button with page from pages section in manifest
You can press the Pop Out button and a new window will be opened with your app page. You can view and debug your application with this window.
Reloading the app
To reload your app you have to press the Reload button in the Developer section in settings menu:

Reload your app to update sources
This button will reload all your app pages and widgets at once, and will also pick up any changes to your manifest.json file. If you want to use a more advanced reload scheme, please contact the Streamlabs development team to see how we can better accommodate your developer flow.
Unloading the app
To delete your application from Streamlabs Desktop, you should click on Unload button in the Developer section from the settings menu:

Delete your app from Streamlabs Desktop
Testing sources in the browser
When testing an app source in Streamlabs Desktop, you won't be able to use chrome dev tools or do any in depth debugging. To debug your widget files, we recommend loading them in a browser of your choice. Please keep in mind that our browser source is built on the Chromium Embedded Framework, so it will be most similar to Google Chrome.
To do this, open the source settings by double-clicking on it:
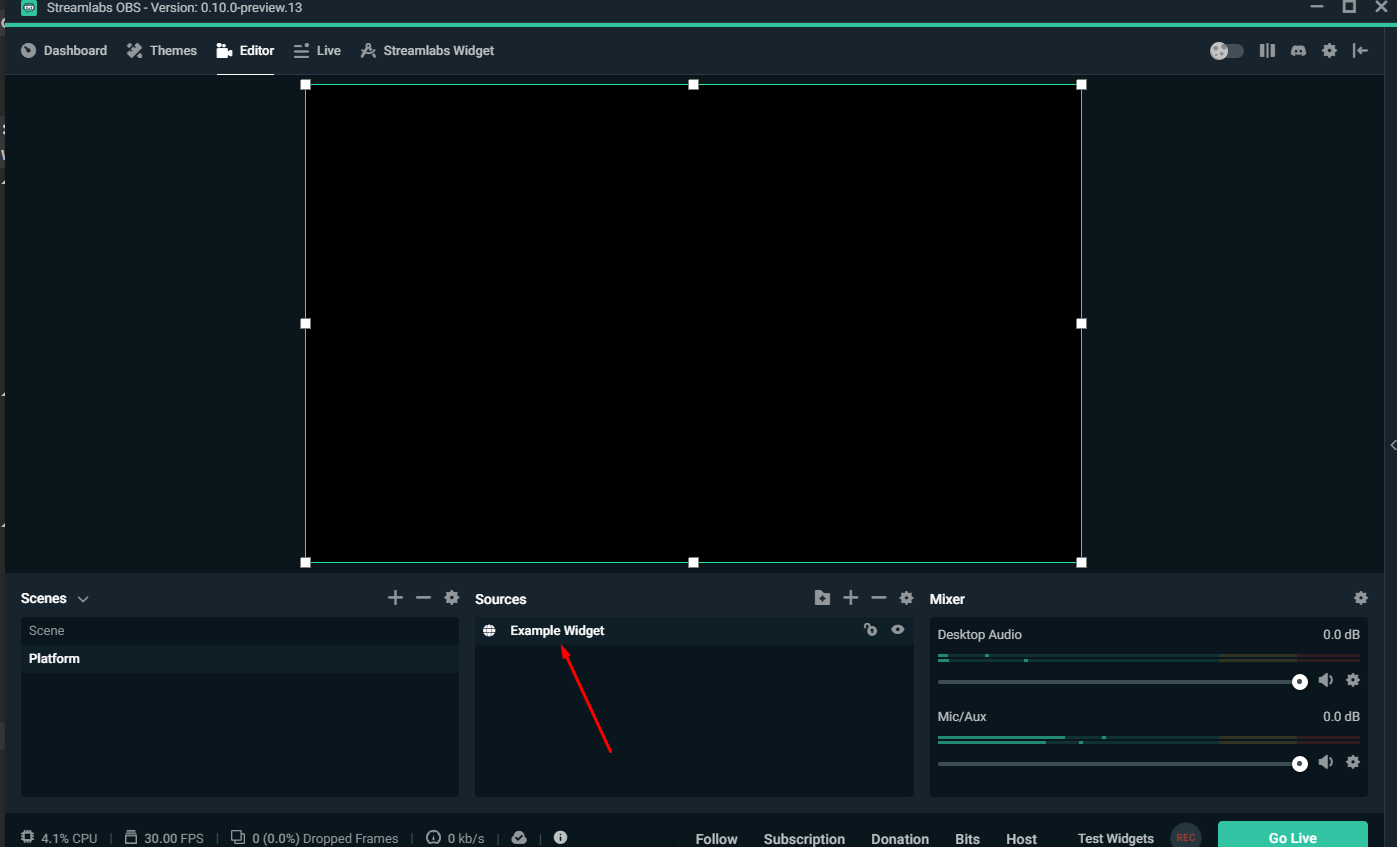
Double click on the source
From the settings menu copy the URL into your browser and continue to debug and inspect as always using browsers dev tools:
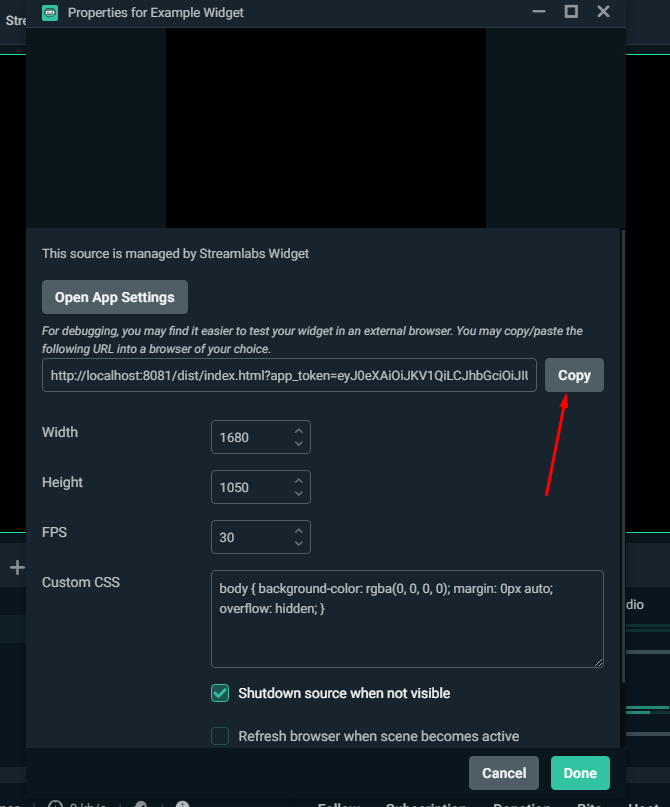
Copy this URL to the browser to use default dev tools
Updated 11 months ago
